Boone, Campbell and Kenton counties have 17 designated Opportunity Zone tracts on the CDFI Fund’s final list, up from 7 in 2018, while Kentucky falls from 144 tracts to 137. Covington holds seven by OZI’s Census analysis, only three tracts carry over by GEOID, and the designations take effect January 1, 2027.
COVINGTON, Ky. — Northern Kentucky’s Opportunity Zone map more than doubles on January 1, 2027. The CDFI Fund final list has 17 designated tracts in Boone, Campbell and Kenton counties, up from 7 on the 2018 CDFI list, while Kentucky as a whole falls from 144 tracts to 137. By an Opportunity Zone Invest analysis of Census geography, Covington holds seven of the 17. The region now has 12.4 percent of the state’s designated tracts, up from 4.9 percent in 2018. Only three of the 17 tracts carry over by GEOID.
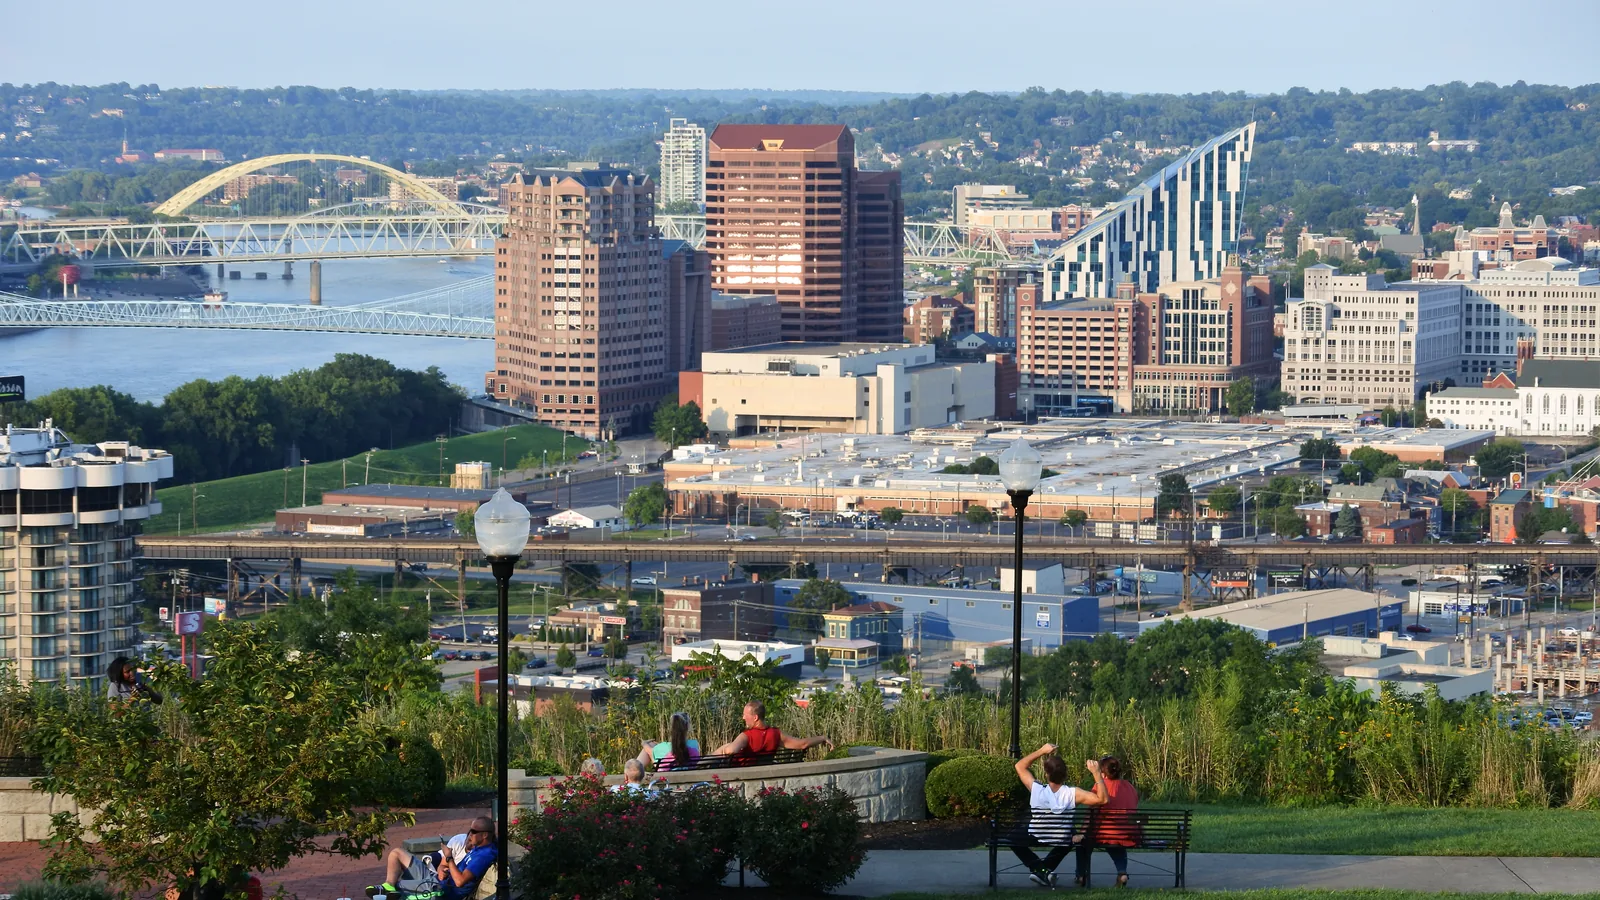
Lead photo: the Covington skyline from Devou Park, with the Ohio River at left. City-context photograph; it does not show a designated tract. Credit: EEJCC / Wikimedia Commons, CC BY-SA 4.0; cropped and resized.
The Kentucky Cabinet for Economic Development’s October 29 release lists the three counties at 5 (Boone), 5 (Campbell) and 7 (Kenton), part of 137 tracts in 76 counties, and the November 5 announcement says all 6,576 nominated tracts nationwide are designated effective January 1, 2027, for ten years. The CDFI workbook matches the state’s three county counts, and all 17 tracts are Non-Rural; 90 of Kentucky’s 137 are Rural. The three counties’ 17 tracts are one fewer than Jefferson County (Louisville), the state’s largest list at 18.
The 17 tracts
The table lists every designated tract in the three counties. Poverty rates are from Treasury’s October 30, 2026 eligibility file (2020–2024 American Community Survey). The place column is Opportunity Zone Invest’s own analysis: each tract’s Census internal point matched to a Census incorporated place. A tract can straddle city limits, and zone status follows the tract, not the city.
| Tract | County | Place (OZI analysis) | Poverty rate | 2018 GEOID match |
|---|---|---|---|---|
| 701.01 | Boone | Florence | 20.1% | No |
| 701.02 | Boone | Florence | 4.4% | No |
| 702.01 | Boone | Florence | 14.5% | No |
| 702.02 | Boone | Florence | 20.9% | No |
| 703.01 | Boone | Outside any city | 20.1% | No |
| 501 | Campbell | Newport | 35.7% | No |
| 506 | Campbell | Newport | 25.0% | No |
| 511.01 | Campbell | Dayton | 13.1% | No |
| 525 | Campbell | Southgate | 25.2% | No |
| 533.01 | Campbell | Outside any city | 22.1% | No |
| 609 | Kenton | Covington | 30.8% | Yes |
| 610 | Kenton | Covington | 32.7% | No |
| 613 | Kenton | Covington | 19.1% | No |
| 650 | Kenton | Covington | 34.6% | No |
| 651 | Kenton | Covington | 45.8% | No |
| 670 | Kenton | Covington | 21.3% | Yes |
| 671 | Kenton | Covington | 33.3% | No |
Source: CDFI Fund final list; Treasury eligibility file; Opportunity Zone Invest analysis of Census geography. Tract numbers link to tract pages.
The announcement from Southbank Partners and The Catalytic Fund, published by the Northern Kentucky Tribune, lists tract 525 under Newport, Southgate and Wilder, tract 533.01 under Wilder, Highland Heights and Cold Spring, and tract 703.01 under Florence. OZI’s internal-point check places 525 in Southgate and leaves 533.01 and 703.01 outside any incorporated place, which is why Florence has four tracts in the table, not five. None of these assignments is official.
Seven zones in 2018, 17 in 2027
The 2018 CDFI list had 144 Kentucky tracts, seven of them in these counties: Kenton 5, Boone 1 and Campbell 1. Only three of today’s 17 share a GEOID with that list, all in Kenton County and all in Covington: 609, 670 and 671. The other 14 are new by GEOID. The 2018 list used 2010 Census tract numbers, so a renumbered tract can overlap an old zone without matching its GEOID; the three-tract figure is the conservative count. By GEOID, none of the five Boone tracts and none of the five Campbell tracts were on the 2018 list.
Poverty ranges from 4.4 percent in Florence tract 701.02 to 45.8 percent in Covington tract 651. Treasury’s file flags all 17 as eligible low-income communities, either on poverty of at least 20 percent with income no more than 125 percent of the metro median, or on income at or below 70 percent of it. Four tracts have poverty below 20 percent (701.02, 702.01, 511.01 and 613), and their income ratios of 59.7 to 65.4 percent of the Cincinnati area median are what qualify them.
The announcement says the regional application for Boone, Campbell and Kenton counties asked for 25 tracts and 17 were designated, and that officials had expected about six. Those figures are the announcement’s, not an official state number. Travis Gysegem of The Catalytic Fund, who coordinated the application, said the group was able to “inventory available sites and buildings, obtain letters of support from all three County Judge/Executives and 25 City administrations, and distill the information into a single, comprehensive regional application in just a few short weeks.” Will Weber, Southbank Partners’ president and CEO, said, “These designations can help attract investment to new and existing businesses, support responsible redevelopment efforts, and bring new opportunities to the region.” Dayton Mayor Ben Baker said, “The federal tax incentive will complement the ongoing development activities underway in Dayton that have been transforming our community and will encourage even more investment in our city.”
What this means for investors
The Cincinnati-side corridor went from seven zone tracts to 17, and the new ones are in Florence, Newport, Dayton and Southgate as well as Covington. A parcel that was outside a 2018 zone in those places may now be inside one from January 1, 2027, and a parcel in a 2018 zone may not be. Check the tract of each site with the census tract lookup or the Census Bureau geocoder, then read the county lists for Boone, Campbell and Kenton. City limits do not decide zone status; the tract does.
What happens next
The designations take effect January 1, 2027. The next test is whether the cities and developers named in the regional application turn its inventory of sites and buildings into projects. The announcement does not name a project or financing in any of the 17 tracts, and a designation does not fund or permit anything on its own.
Related. Kentucky Opportunity Zones · Kenton County · Boone County · Campbell County · Kentucky’s 137 tracts · Designated-tract map
Reporting note: Tract counts, rural flags and GEOIDs were read from the CDFI Fund’s final designation workbook and rechecked on November 12, 2026; the 2018 comparison was counted from the CDFI Fund’s 2018 list, matching identical 11-digit GEOIDs. Poverty rates and income ratios were read from Treasury’s October 2026 eligibility file. County counts match the Kentucky Cabinet for Economic Development’s October 29 release. Tract-to-place assignments are Opportunity Zone Invest’s own analysis using Census Bureau tract internal points; they are not official. The 25-tract request, the six-zone expectation and the quotations come from the Southbank Partners and Catalytic Fund announcement as published by the Northern Kentucky Tribune; the Tribune was not used for tract data. No outreach and no independently conducted interviews. Educational reporting, not tax, legal or investment advice.
FAQ
How many Opportunity Zones does Northern Kentucky have?
17 designated tracts: 5 in Boone County, 5 in Campbell County and 7 in Kenton County, all Non-Rural. The 2018 list had 7 in the three counties.
How many of the tracts are in Covington?
Seven. By Opportunity Zone Invest’s analysis of Census internal points, all seven Kenton County tracts are inside Covington. That assignment is not official.
How many of the 17 were also zones in 2018?
Three share an identical GEOID with the 2018 list, all in Kenton County. Tract numbers changed between the 2010 and 2020 Censuses, so some others may overlap old zones.
When do the designations take effect?
January 1, 2027, for ten years, according to Treasury’s November 5 announcement.
How do I know if a Northern Kentucky site is in a zone?
Zone status follows the census tract, not the city limits. Look up the parcel’s tract with the census tract lookup or the Census Bureau geocoder and compare it with the county list.
- newkentuckyhome.ky.gov, as of November 12, 2026
- cdfifund.gov (1), as of November 12, 2026
- cdfifund.gov (2), as of November 12, 2026
- home.treasury.gov (1), as of November 12, 2026
- home.treasury.gov (2), as of November 12, 2026
- nkytribune.com, as of November 12, 2026
Original reporting by the Opportunity Zone Invest Editorial Team for Opportunity Zone Invest, an independent OZ 2.0 research site. Facts are drawn from the primary sources cited above per our editorial standards. Nothing here is tax, legal, or investment advice. Found an error? See our corrections policy or write to Opportunity Zone Invest.
OZ tools: Opportunity Zone calculator · OZ 2.0 designation checker · 180-day rule calculator · Form 8997 instructions · Form 8996 instructions · all tools
Get OZ 2.0 updates
OZ 2.0 news, guidance, and key deadlines. Unsubscribe anytime.