Treasury’s final list makes 6,576 tracts Opportunity Zones on January 1, 2027. Seven years of evidence from the 2018 map is mixed: ATTOM finds home prices in zones rose a little less often than elsewhere, and careful studies range from no measurable effect to single-digit gains. Two 2018 zones on the new list, in Lancaster, Pennsylvania, and Little Rock, Arkansas, diverged: one far outpaced its county, while the other lagged and has slipped since 2022. Living in a zone brings homeowners no tax break.
WASHINGTON, D.C. — The new map arrives on January 1. Treasury’s final list, published November 5, designates 6,576 census tracts as Opportunity Zones for 2027 through 2036. That includes 2,594 rural tracts. For anyone who owns a house inside one of those lines, one question follows quickly: will the designation make it worth more?
The question got louder last week. A Realtor.com story by Tristan Navera ran under the headline that home values are “already surging in key states.” It cited ATTOM data showing that 27.1% of 2018-era zone tracts posted double-digit annual home-price growth.
The figure is accurate. What it leaves out is the comparison.
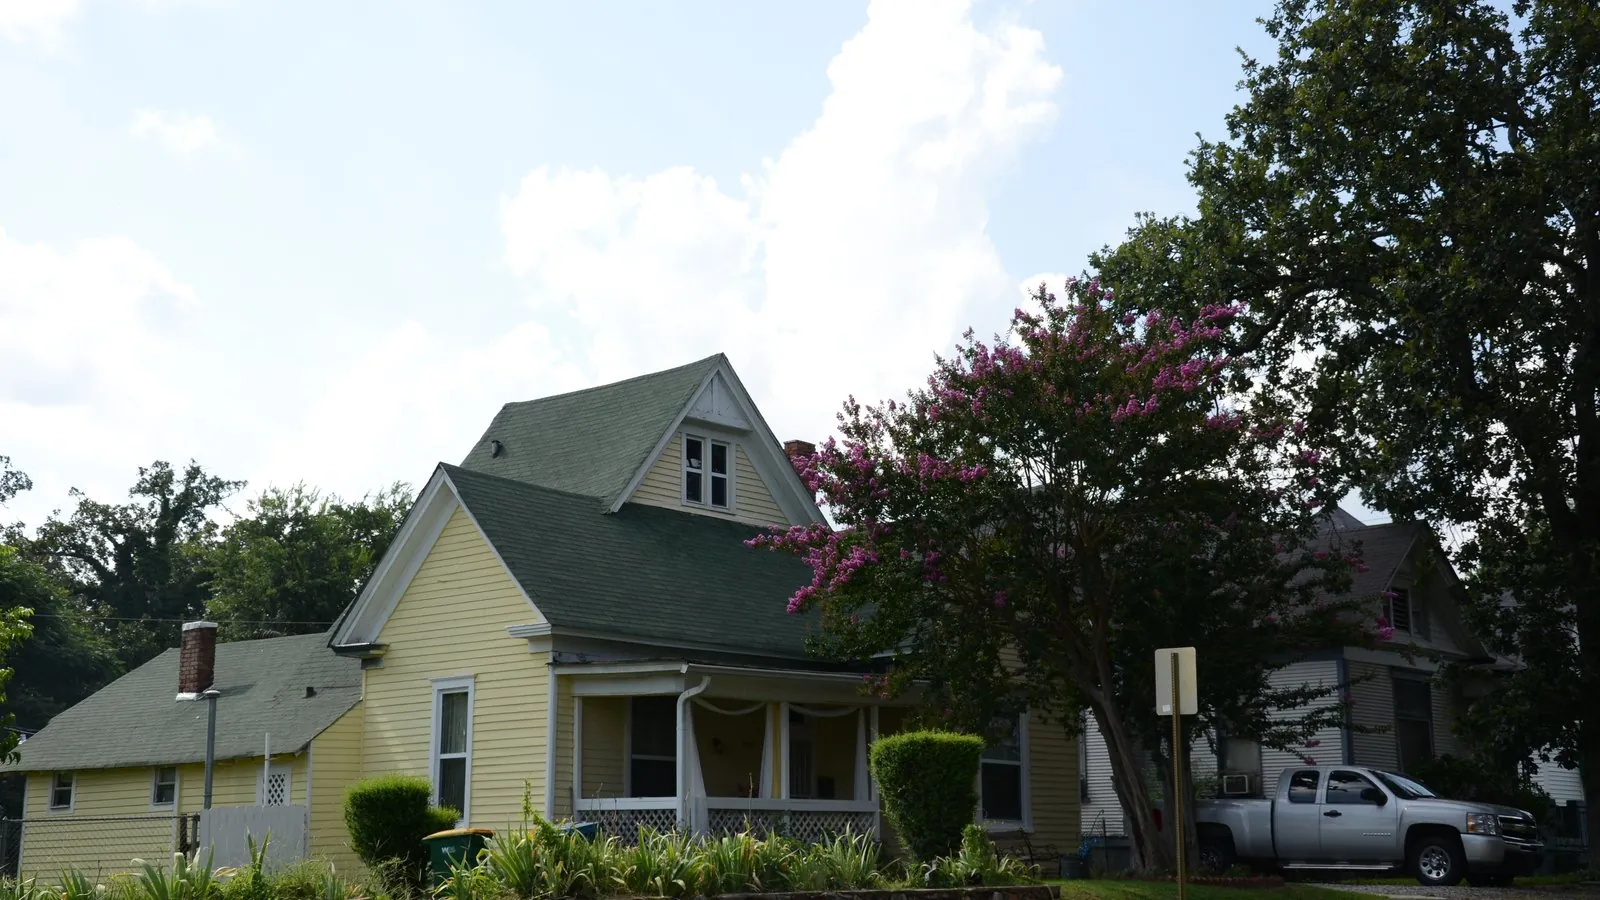
Lead photo: Houses in the Paul Laurence Dunbar School Neighborhood Historic District in central Little Rock, Arkansas. The district lies in census tract 47, which was a 2018 Opportunity Zone and is on the 2027 final list. Photographed in 2015. Credit: Valis55 / Wikimedia Commons, CC BY-SA 3.0; cropped and resized.
What ATTOM actually measured
ATTOM’s third-quarter 2026 Opportunity Zones report, released November 5, uses recorded sales deeds. It looked at 3,805 zone tracts that had at least five home sales in the quarter.
- Annual growth: median prices rose year over year in 48.9% of zone tracts with enough data. Outside the zones, they rose in 51.6% of tracts.
- Double-digit gains: 27.1% of zone tracts saw prices climb at least 10%, compared with 29.4% of tracts outside.
ATTOM’s own conclusion is plain. Areas outside the zones “experienced median home price growth at a greater rate than areas inside the zones and were more likely to see double-digit median home price increases.”
“Opportunity Zones remain a notably lower-cost segment of the housing market, with nearly 80 percent of these areas posting median home prices below the national median,” ATTOM CEO Rob Barber said in the release. Inside the zones, 79.5% of tracts had medians below the national figure of $368,000, against 50.4% outside. ATTOM also warns that thin sales make tract medians volatile. In 79.1% of the 3,431 zone tracts with enough data to compare quarters, the median moved more than 5% in a single quarter.
That data doesn’t show zones beating the market. It shows cheaper neighborhoods moving roughly with it.
What the careful studies find
A raw comparison can’t tell you whether the zone itself made a difference. Researchers try to answer that by comparing designated tracts with similar tracts that were eligible but passed over. Their answers differ, and the differences are worth knowing.
- Little or no effect. In the Journal of Urban Economics, Jiafeng Chen, Edward Glaeser and David Wessel compared zone tracts with eligible tracts that were not picked. Their most credible estimates “rule out price impacts greater than 0.5 percentage points with 95% confidence.” Prices fell in places with little employment. The authors suggest buyers there expected the incentive to add housing supply. Their price data run only through 2020, about 27 months after the zones were named.
- Single-digit gains. Two later studies found modest increases. Using CoreLogic records, Yanling Mayer and Edward Pierzak estimated excess single-family price appreciation of 6.8% from 2018 to 2020 (HUD’s Cityscape, 2022). A 2024 study of 36.1 million residential sales by Ron Bekkerman and co-authors put the increase at 4.03% to 6.13%. It also found that tracts with higher prices were more likely to be selected.
Selection is the hard part. Governors didn’t choose tracts at random. A Federal Reserve working paper published this year found that states favored tracts where construction projects were already being planned. “About two-thirds of the greater construction growth in OZs can be attributed to this selection,” the authors write. A neighborhood that was already rising before 2018 will look like a zone success story even if the tax break did little.
Displacement is the other side of the ledger. A September 2026 Brookings report defines displacement as a loss of total population or of a tract’s plurality racial or ethnic group other than non-Hispanic white residents. By that measure, it found displacement in 45% of designated zones. It found no consistent link between displacement and faster building, and only 26% of zones saw growth without displacement. “Investment alone is not synonymous with shared prosperity,” the authors write.
Two 2018 zones, two directions
Lancaster, Pennsylvania and Little Rock, Arkansas each have a tract that was a 2018 zone and is on the 2027 final list. The figures below come from the Federal Housing Finance Agency’s annual tract-level house price index. FHFA calls the series developmental. It is built from appraisals and sales on Fannie Mae and Freddie Mac mortgages, so it does not count every sale.
Lancaster, tract 14. On Lancaster’s south side, tract 14 (GEOID 42071001400) had the kind of chart a booster would frame. Its index rose 162.5% from 2017 to 2025. Lancaster County’s index rose 80.9% over the same years. But the tract was already outpacing the county before designation: 23.6% from 2010 to 2017, against 6.6% countywide. That is the selection problem the Fed paper describes. The rise in prices has not lifted incomes to match. In Treasury’s eligibility file, which uses 2020 to 2024 Census survey data, the tract’s poverty rate is 30.0%. Its median family income is $43,118, or 41.3% of the metro median.
Little Rock, tract 47. In central Little Rock, tract 47 (GEOID 05119004700) includes the Paul Laurence Dunbar School neighborhood. Its index rose 23.3% from 2017 to 2025, while Pulaski County’s rose 48.4%. The tract peaked in 2022 and has fallen 7.9% since. The same zone status that came with a boom in Lancaster came with a lag here.
A new zone to watch
Some 2027 zones have no history in the program. In Findlay, Ohio, tract 9.02 (GEOID 39063000902) is Hancock County’s only designated tract. It is marked Rural, and it was not a 2018 zone. Its FHFA index rose 57.8% from 2017 to 2025, about even with the county’s 58.9%. That makes it a clean test: until now it has moved in step with its county, so any gap that opens after 2027 will be easy to see.
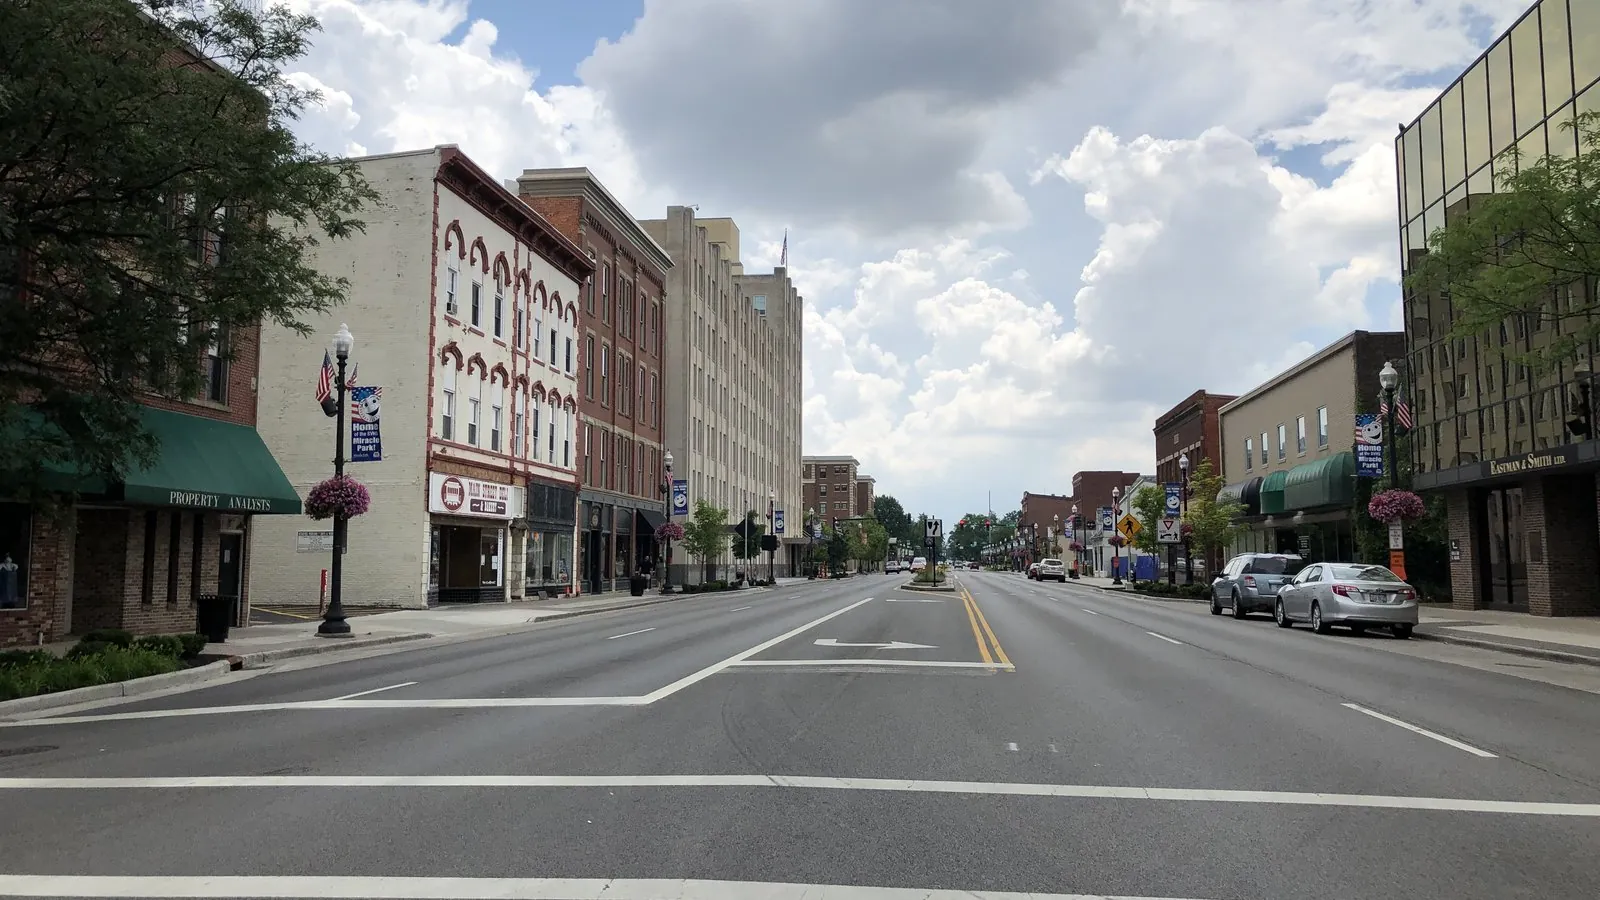
Findlay Mayor Christina Muryn told The Courier that the designation “gives us another way to attract private investment that can bring vacant or deteriorating properties back into use, create more housing options, and help neighborhood businesses grow.”
What owners should know
Owning or buying a home in a zone brings no Opportunity Zone tax benefit. Under IRC §1400Z-2, the incentive applies to capital gains invested through a qualified opportunity fund, which must hold at least 90% of its assets in qualifying zone property. A primary residence is not that. Our guide to buying a home in an Opportunity Zone explains the details. This article is not tax advice.
What a designation can change is who comes looking. The research suggests investment tends to follow places that were already moving. The tax break is unlikely to create that movement on its own.
What happens next
To see whether a property is inside a 2027 zone, use the designation checker or browse the OZ 2.0 final list and the map. For the earlier ATTOM numbers, see our August report on the Q2 data.
FAQ
Does living in an Opportunity Zone give a homeowner a tax break?
No. The Opportunity Zone incentive under IRC §1400Z-2 applies to capital gains invested through a qualified opportunity fund. Owning or buying a home you live in inside a zone does not qualify for it.
Do Opportunity Zones raise home prices?
Not reliably. ATTOM’s Q3 2026 data found that prices rose year over year in 48.9% of zone tracts and 51.6% of other tracts. Peer-reviewed estimates range from no measurable effect (Chen, Glaeser and Wessel) to gains of about 4% to 7% (Mayer and Pierzak; Bekkerman et al.).
Why do some Opportunity Zones show big price gains?
Much of it is selection. A Federal Reserve working paper found that states favored tracts where construction was already being planned. In Lancaster, Pennsylvania, tract 14 rose 162.5% from 2017 to 2025, but it had already outpaced its county before designation.
When do the new Opportunity Zones take effect?
The 6,576 tracts on Treasury’s final list take effect January 1, 2027, and keep the designation through December 31, 2036.
- attomdata.com, as of November 16, 2026
- realtor.com, as of November 16, 2026
- doi.org (1), as of November 16, 2026
- huduser.gov, as of November 16, 2026
- doi.org (2), as of November 16, 2026
- federalreserve.gov, as of November 16, 2026
- brookings.edu, as of November 16, 2026
- fhfa.gov (1), as of November 16, 2026
- fhfa.gov (2), as of November 16, 2026
- home.treasury.gov (1), as of November 16, 2026
- cdfifund.gov (1), as of November 16, 2026
- cdfifund.gov (2), as of November 16, 2026
- home.treasury.gov (2), as of November 16, 2026
- thecourier.com, as of November 16, 2026
- law.cornell.edu, as of November 16, 2026
Original reporting by the Opportunity Zone Invest Editorial Team for Opportunity Zone Invest, an independent OZ 2.0 research site. Facts are drawn from the primary sources cited above per our editorial standards. Nothing here is tax, legal, or investment advice. Found an error? See our corrections policy or write to Opportunity Zone Invest.
OZ tools: Opportunity Zone calculator · OZ 2.0 designation checker · 180-day rule calculator · Form 8997 instructions · Form 8996 instructions · all tools
Get OZ 2.0 updates
OZ 2.0 news, guidance, and key deadlines. Unsubscribe anytime.