Ten counties hold 746 of the 6,576 census tracts on Treasury’s final Opportunity Zone list, which takes effect January 1, 2027, for ten years. Los Angeles County leads with 201, followed by Cook County, Illinois, with 84 and Brooklyn with 67. Harris and Hidalgo counties in Texas and Miami-Dade tie for eighth at 51. Only five of the 746 are rural. Here is where those zones sit, who lives there and what is being built.
LOS ANGELES, Calif. — From the high desert around Palmdale to the warehouse blocks south of downtown, Los Angeles County holds more Opportunity Zones on the 2027 map than any other county in the United States: 201 census tracts. That is more than the whole designated total of 46 of the 56 states and territories on Treasury’s final list.
The map, announced by Treasury on November 5, designates 6,576 tracts across the country. It takes effect January 1, 2027, and runs for ten years, through December 31, 2036, under IRS Notice 2026-67. The zones are spread across 1,917 counties and county equivalents, but they are not spread evenly. Ten counties hold 746 of them, or 11.3% of the national list.
Those ten counties are a portrait of where American poverty is concentrated, and of where much of the country’s rebuilding is happening. The list runs from the South Side of Chicago to Brooklyn’s eastern edge, from Detroit’s rail station to the Rio Grande Valley’s produce bridges. Only five of the 746 tracts are rural.
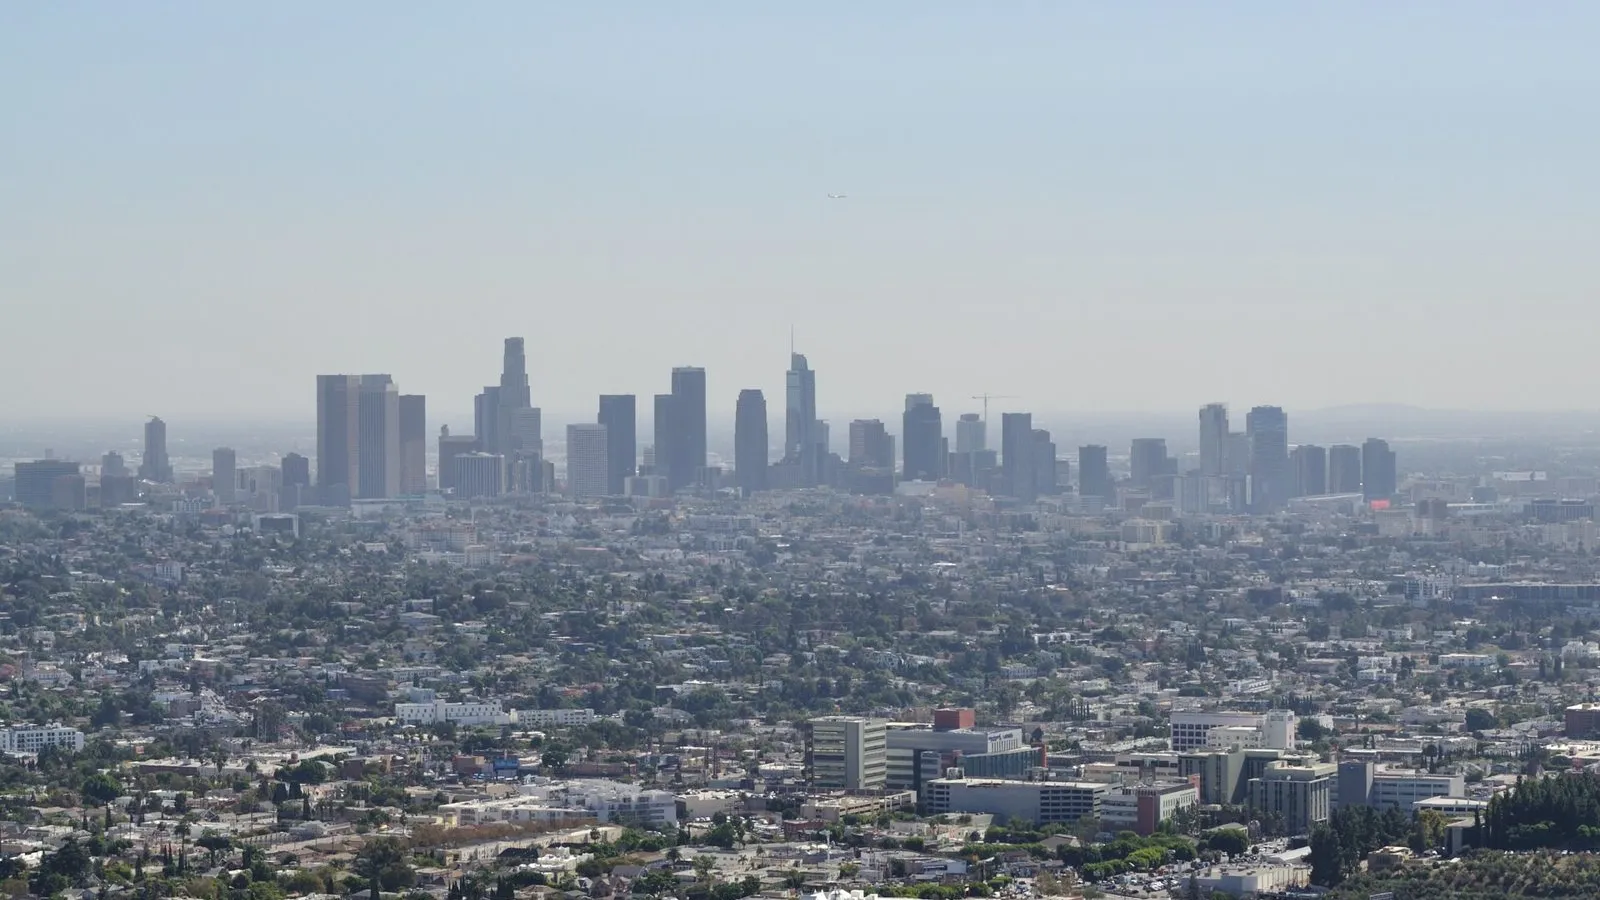
Lead photo: Downtown Los Angeles seen from Griffith Observatory in October 2024. Downtown and the neighboring Wholesale District, Little Tokyo and Chinatown hold 18 of Los Angeles County’s 201 designated tracts. Credit: The Fun Chronicles / Wikimedia Commons, CC0; cropped and resized.
How we counted
We counted every tract on the CDFI Fund’s final list by county, using the first five digits of each tract’s 11-digit census code. Each county’s total was checked against its page on this site. Eligibility counts come from Treasury’s October 30, 2026 eligibility file. Population, income and poverty figures for each county come from the Census Bureau’s 2020–2024 American Community Survey five-year estimates. Neighborhood counts place each tract by its Census internal point, so a tract that straddles a boundary is counted once.
Three counties tie for eighth with 51 tracts each, so the list has exactly ten entries. Philadelphia County is next, with 47.
Comparisons with the first map need a caveat. The 2018 list was drawn on 2010 census tracts, and the 2027 list uses 2020 tracts, which were split and redrawn after the last census. County totals from the two rounds are therefore not exact equivalents.
| Rank | County | Designated | Eligible | Share |
|---|---|---|---|---|
| 1 | Los Angeles County, Calif. | 201 | 840 | 23.9% |
| 2 | Cook County, Ill. | 84 | 482 | 17.4% |
| 3 | Kings County (Brooklyn), N.Y. | 67 | 406 | 16.5% |
| 4 | Wayne County, Mich. | 65 | 337 | 19.3% |
| 5 | Dallas County, Texas | 60 | 279 | 21.5% |
| 6 | Maricopa County, Ariz. | 59 | 241 | 24.5% |
| 7 | Bronx County, N.Y. | 57 | 270 | 21.1% |
| 8 (tie) | Harris County, Texas | 51 | 500 | 10.2% |
| 8 (tie) | Hidalgo County, Texas | 51 | 133 | 38.3% |
| 8 (tie) | Miami-Dade County, Fla. | 51 | 247 | 20.6% |
Designated: tracts on Treasury’s final list. Eligible: low-income community tracts in Treasury’s October 30, 2026 eligibility file. Share: designated as a percentage of eligible. Source: CDFI Fund final list, Treasury eligibility file; OZI count.
1. Los Angeles County, California: 201 tracts
Los Angeles County leads for a simple reason: it is enormous. It has 9.8 million residents and 2,498 census tracts, more than some states. Of those tracts, 840 met the federal low-income test. That gave Los Angeles County 33.9% of California’s eligible tracts, and it ended up with 32.4% of the state’s 620 designations.
California chose its tracts with a formula. The Governor’s Office of Business and Economic Development says the Department of Finance scored all 2,479 eligible tracts on poverty, median family income, renter cost burden, crowding and unemployment. The state then took 3,754 public comments on 863 tracts. The final 620 cover about 2.6 million people in 55 counties.
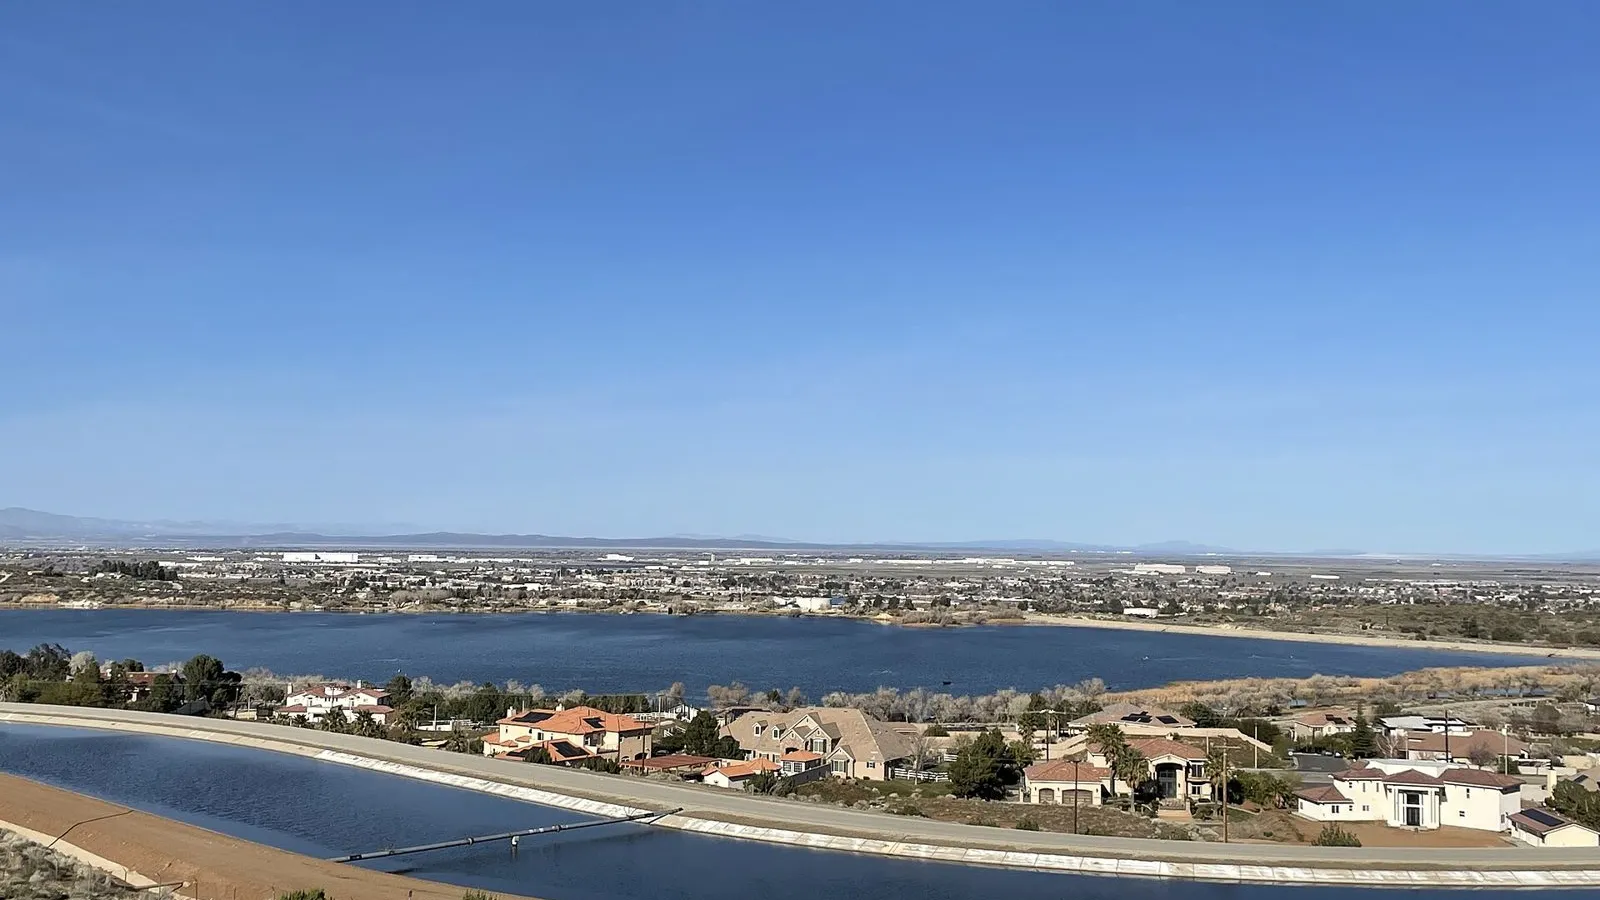
Inside the county, the zones go well beyond the city of Los Angeles, which holds 111 of them. Long Beach has 10, Palmdale has 9, El Monte has 8, and South Gate and Inglewood have 6 each, with the rest scattered across 35 cities and communities in all. Using the county’s own neighborhood boundaries, the biggest clusters are downtown and the Wholesale District (14 together), Vernon Central (6), Westlake and Harvard Park (5 each), and Watts, Florence-Firestone and Boyle Heights (4 each). In the San Fernando Valley, Van Nuys has 5, and Pacoima, Panorama City and North Hills have 3 each. The county’s only rural designated tract is in Lake Los Angeles, in the Antelope Valley.
Countywide, median household income is $90,112, above the national $80,734. The designated tracts tell a different story: their median poverty rate is 24.2%, and their median family income is 58% of the comparison income Treasury uses. Nearly half of county residents (48.4%) are Hispanic, and a third were born abroad. The median rent, $1,954, is the highest of any county on this list.
The economy runs on trade and, increasingly, defense. The Port of Los Angeles handled 10.2 million container units in 2025 and has been the busiest container port in the Western Hemisphere for 26 straight years. In Palmdale, the Air Force and Northrop Grumman broke ground on September 29, 2026 on a new B-21 bomber final-assembly facility at Air Force Plant 42. It will add more than 1 million square feet and raise production capacity by 25%. Palmdale’s city hall sits in designated tract 9105.01.
Not everyone expects the map to spark new building on its own. Kevin Wilson of the accounting firm Novogradac told Bisnow that “much has been learned” since 2018, adding: “The permanence and the rolling deferral is going to add stability to the program.” The 2018 map gave the county 274 tracts on the older boundaries.
2. Cook County, Illinois: 84 tracts
Cook County is home to 5.2 million people, and its 1,332 census tracts include half of all eligible tracts in Illinois, 482 of 957. It did not get half of the state’s zones. Cook County received 84 of Illinois’s 240 designations, or 35%. The state spread the rest downstate: Governor JB Pritzker’s office said that 32.5% of the Illinois tracts are rural.
“Through a data-driven evaluation and extensive statewide engagement, we identified 240 census tracts with potential to attract new investment, support business growth, expand economic opportunity, and strengthen local economies,” said Kristin Richards, director of the state’s commerce department, in the November 5 announcement.
Chicago has 56 of the county’s tracts, and the suburbs have 28. Within the city, the heaviest cluster is South Chicago, the old steel neighborhood on the lakefront, with 8. The Near West Side, North Lawndale and South Shore have 4 each, and Rogers Park, Humboldt Park and Austin have 3 each. In the suburbs, Harvey has 6, followed by Chicago Heights with 2, and 20 more towns have one each, from Elk Grove Village to Park Forest. Countywide median household income is $83,498. The median poverty rate in the designated tracts is 25.5%.
South Chicago is also the site of the biggest project on this list. The Illinois Quantum and Microelectronics Park is rising on the 128-acre site of U.S. Steel’s South Works, which employed up to 20,000 workers at its peak and closed in 1992. Structural steel for anchor tenant PsiQuantum’s building was going up by April 2026. “This land has not done anything for us in the last 30 years,” Malki Brown, president of the Euclid Block Club, said in an article published by the park. Nearby, the lakefront tract 4601 is designated.
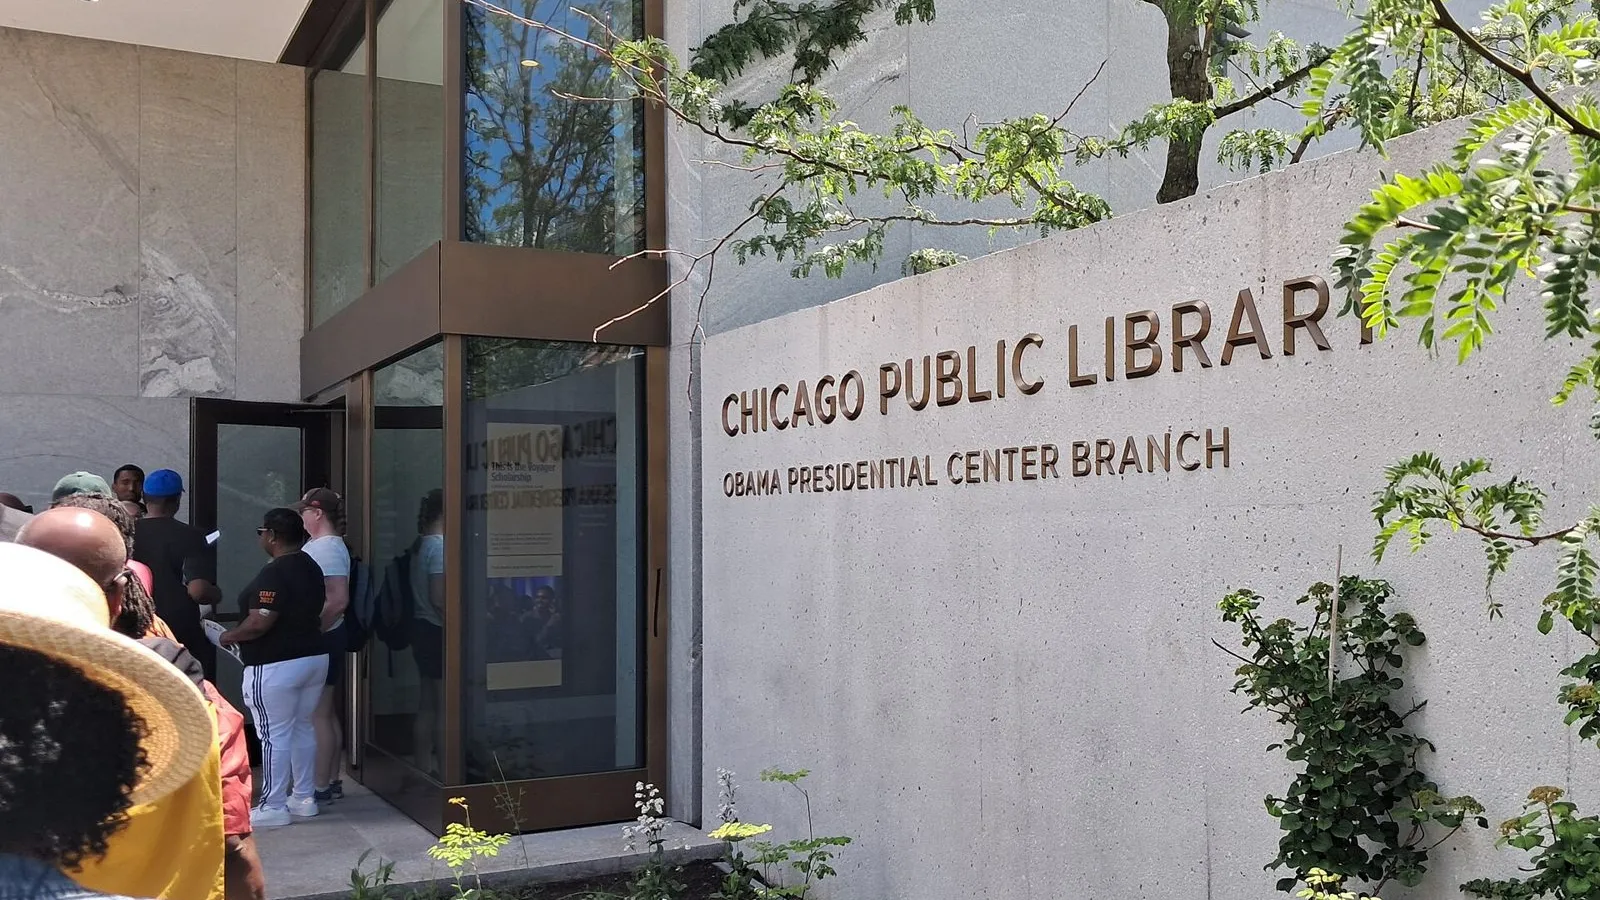
A few miles north, the Obama Presidential Center opened to the public in Jackson Park on June 19, 2026. Its tract 4201 is eligible but was not designated, a reminder that a famous address does not guarantee a place on the list. Under the 2018 map, Cook had 181 tracts.
3. Kings County (Brooklyn), New York: 67 tracts
Brooklyn is the most populous of New York City’s five boroughs, with 2.6 million residents, and it ranks third nationally with 67 zones. New York City as a whole holds 210 of New York State’s 430 tracts, Bisnow reported, with Brooklyn’s 67 at the top. That is still a smaller slice than the borough’s share of the eligible pool. Kings County has 23.6% of the state’s eligible tracts and 15.6% of its designations. The state lists the full map on Empire State Development’s site.
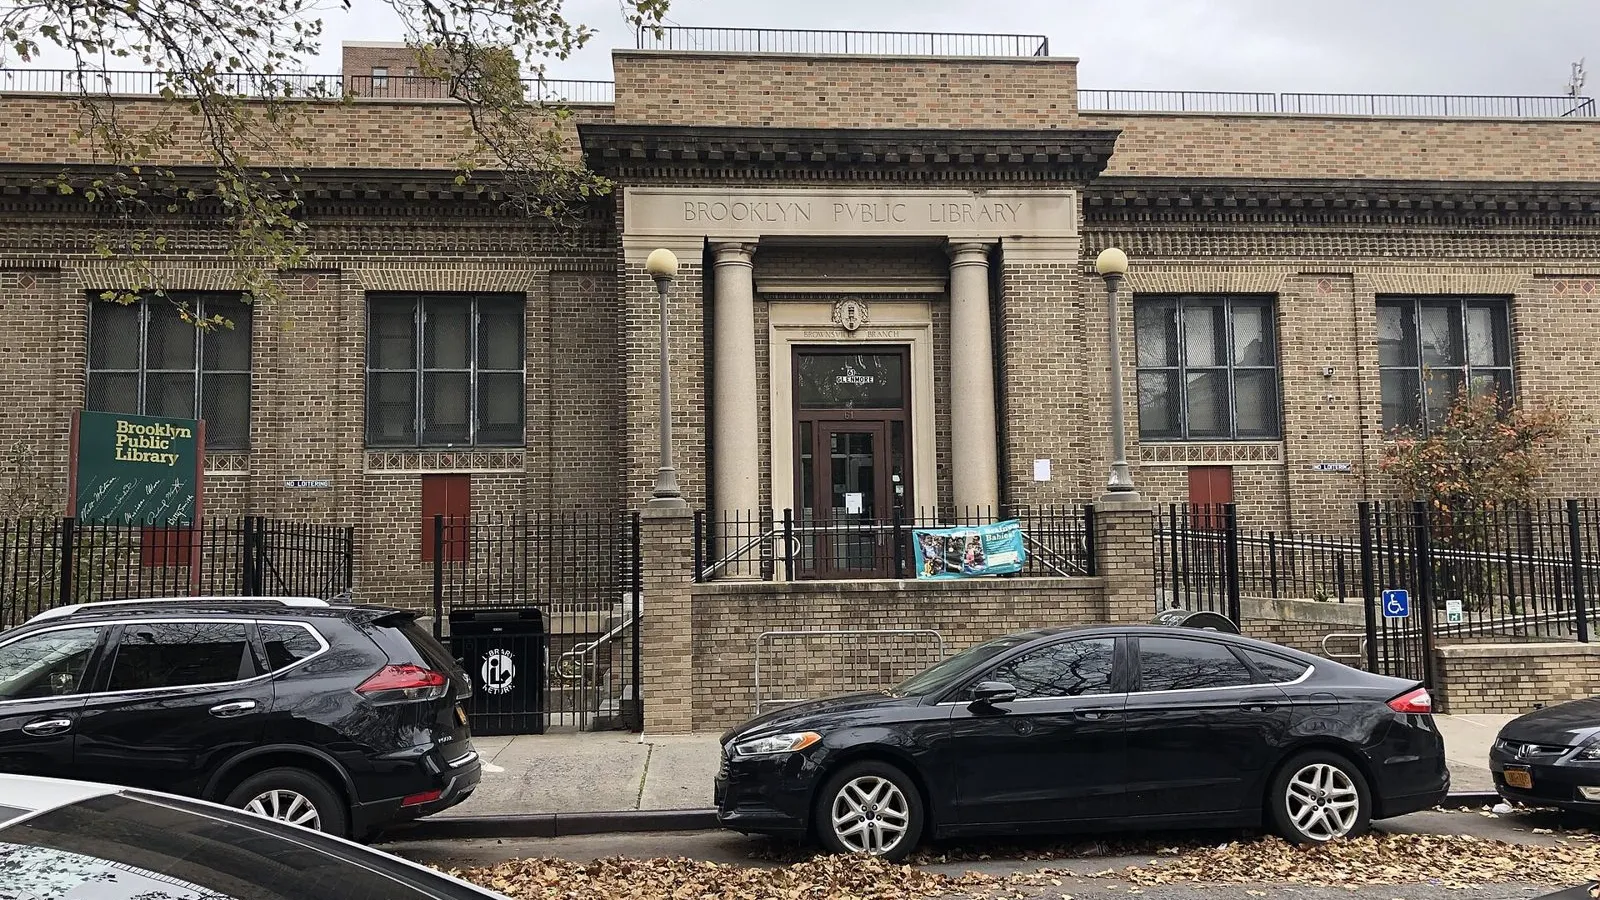
The zones run in a band across the borough’s south and east. By the city’s neighborhood boundaries, Brownsville and Coney Island–Sea Gate have 6 each. East New York has 9 across its two neighborhood areas, and the East New York community district has 13, the most of any district in Brooklyn. Bedford-Stuyvesant has 6 across its east and west halves. East Williamsburg and the Carroll Gardens–Cobble Hill–Gowanus–Red Hook area have 3 each.
These are some of the poorest blocks in a borough whose median household income, $80,263, is close to the national figure. Countywide, the poverty rate is 19.1%. In the designated tracts, the median is 29.7%. More than a third of Brooklynites (35.3%) were born abroad. The borough is 36.1% non-Hispanic white, 26.6% Black, 19.0% Hispanic and 12.1% Asian.
The waterfront is where the largest plans sit. In September 2025, a city task force backed a $3.5 billion vision for the 122-acre Brooklyn Marine Terminal in Red Hook. The plan calls for a 60-acre all-electric port and 6,000 homes, including at least 2,400 permanently affordable units, and is now going through environmental review. In Sunset Park, Industry City’s address at 220 36th Street falls in designated tract 2, which was also a 2018 zone.
Brooklyn had 125 zones on the 2018 map. New York State as a whole went from 514 tracts to 430, according to the accounting firm KSM.
4. Wayne County, Michigan: 65 tracts
More than half of Wayne County’s census tracts were eligible, 337 of 627. The county had 39.2% of Michigan’s eligible pool and received 30.2% of the state’s 215 designations, or 65 tracts. Detroit has 46 of them. Dearborn has 5 and Hamtramck has 4.
The Michigan Economic Development Corporation said it held 13 meetings and took in more than 700 pieces of input, and that its model gave weight to housing and revitalization. “While the breadth of opportunity in our state exceeded our ability to select all due to federal constraints, Team Michigan is going to hit the ground running in January,” said Quentin L. Messer Jr., the agency’s chief executive.
Need here is deep. Wayne County’s median household income is $60,539, and its poverty rate is 20.8%. In the designated tracts, the median poverty rate is 35.2%, the second-highest on this list after the Bronx. The county is 47.9% non-Hispanic white and 36.6% Black. Its 1.77 million residents include fewer immigrants (10.3%) than any other county in the top ten.
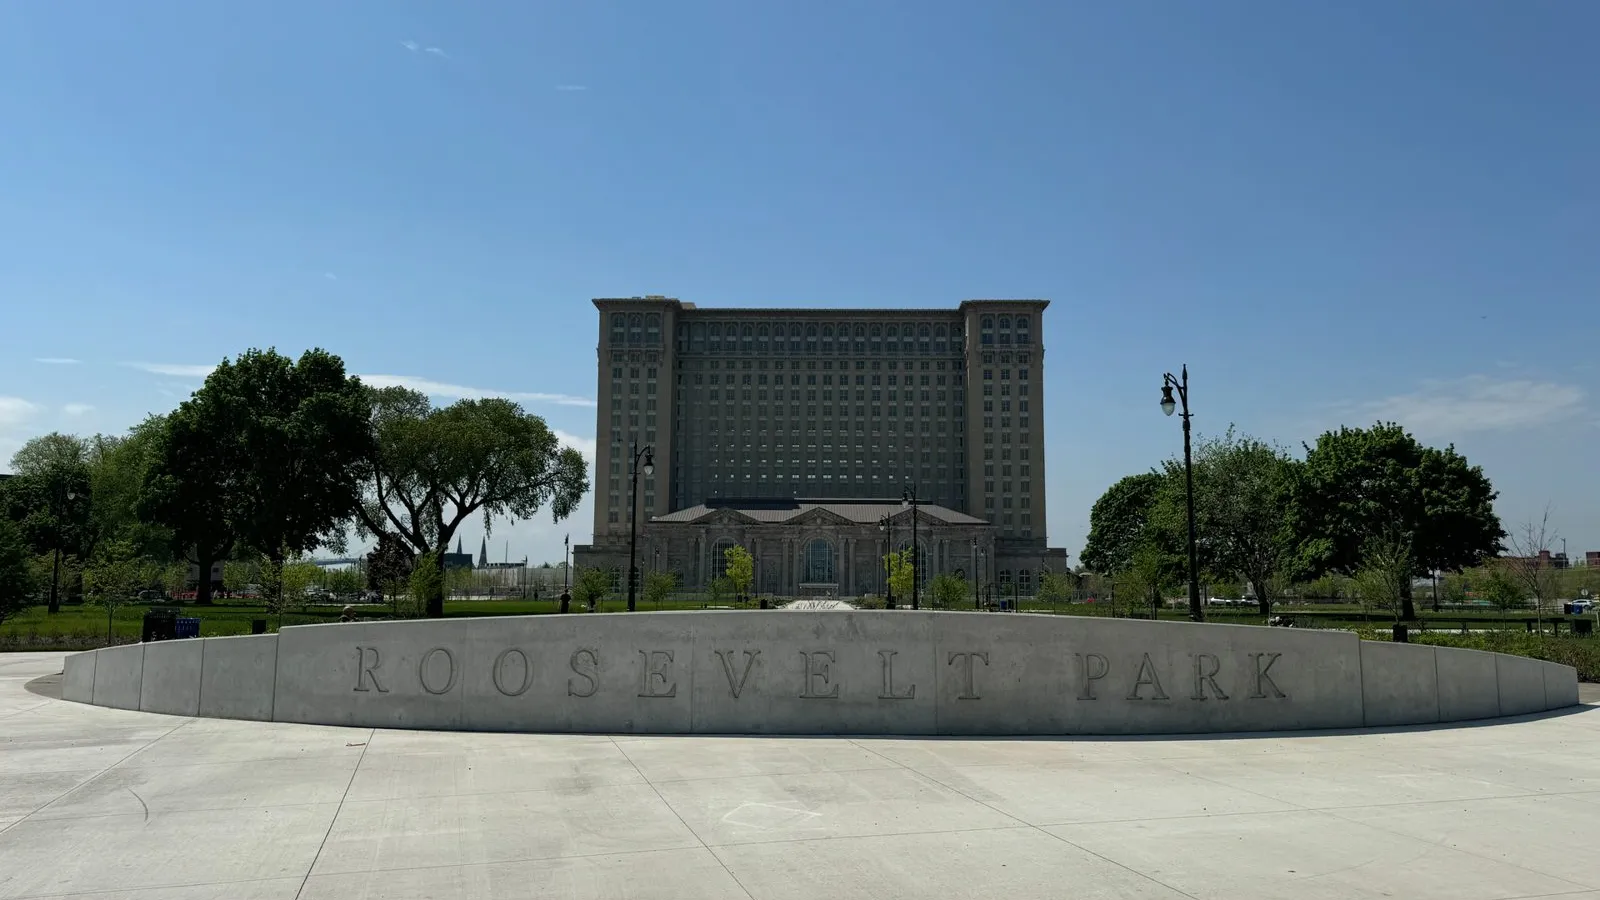
Yet Detroit is growing again. The Census Bureau’s 2024 estimate put the city at 645,705 people, up 6,791 in a year and its second straight annual gain, the city said. The strongest symbol of that turnaround is Michigan Central Station in Corktown. The station sat vacant from 1988 until Ford bought it and spent six years restoring it as the center of a 30-acre technology campus. It reopened on June 6, 2024. Its tract 5214 is on the 2027 list and was also a 2018 zone.
Wayne had 94 zones in 2018.
5. Dallas County, Texas: 60 tracts
No county on this list changed more between the two maps. Under the 2018 map, Dallas County had just 18 zones on the older boundaries. It now has 60. The city of Dallas alone has 43, which a November 13 city memo calls “nearly three times” its 2018 count. The city’s Office of Economic Development put forward 41 of those tracts, and Dallas County put forward 2. Garland has 6, and Carrollton, Irving and Balch Springs have 2 each.
The jump reflects a shift in Texas strategy. The governor’s office designated 608 tracts in 106 counties, compared with 628 tracts in 145 counties in 2018. An analysis by the law firm FBT Gibbons found that the state’s rural share fell from 46% to 30%. That shifted zones toward the big metros, Dallas most of all.
Dallas County has 2.6 million residents and is young, with a median age of 34.1. It is 41.3% Hispanic, 26.4% non-Hispanic white and 22.1% Black, and a quarter of residents were born abroad. Median household income is $76,547. In the designated tracts, the median poverty rate is 23.0%, the lowest on this list.
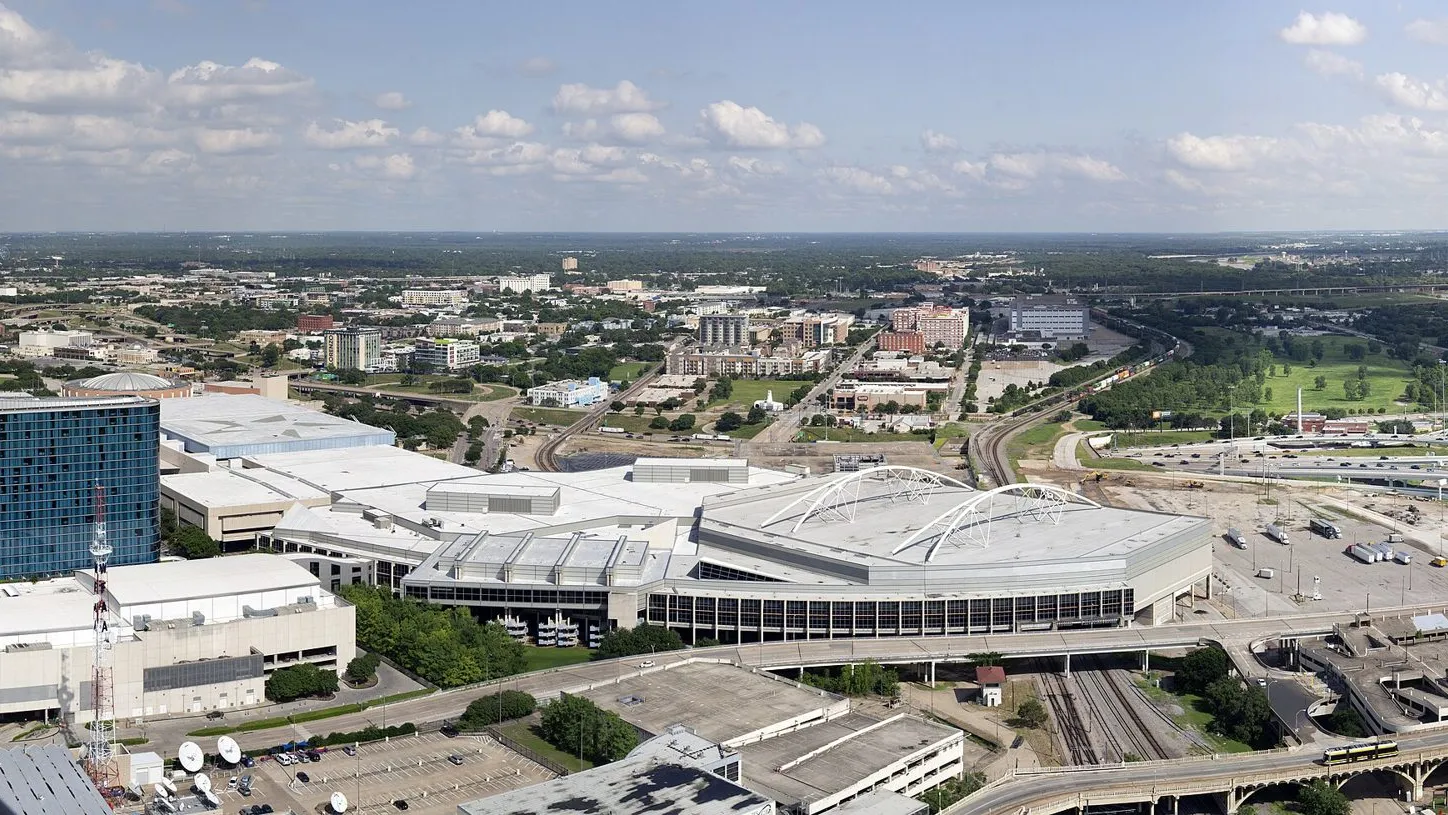
Some zones sit at the civic center of the city. City Hall and the Kay Bailey Hutchison Convention Center share designated tract 204.02. There, the city is replacing the convention center with a 2.1-million-square-foot complex, with 750,000 square feet of exhibit space, due to open in 2030. Demolition of the old buildings is under way. Fair Park, home of the State Fair of Texas, is also in a designated tract.
Assistant City Manager Robin Bentley told Bisnow that the zones could create “new opportunities in communities where additional investment can make a meaningful difference.”
6. Maricopa County, Arizona: 59 tracts
Maricopa County holds Phoenix and most of its metro area: 4.56 million people in 1,009 census tracts. It also holds nearly half of the state’s Opportunity Zones, 59 of Arizona’s 127. The Arizona Commerce Authority said Treasury notified the state on October 29, 2026, that all 127 were designated, in 14 of the state’s 15 counties. Arizona had 168 tracts under the 2018 map.
Phoenix has 31 of the county’s 59 zones. Mesa has 7, Glendale 6 and Tempe 3. Within Phoenix, the city’s Central City village leads with 11, followed by Alhambra and South Mountain with 5 each, Estrella with 4 and North Mountain with 3. Maryvale, on the west side, has 2.
On paper, Maricopa is the most prosperous county in the top ten. Its poverty rate, 11.0%, is below the national 12.5%, and its median household income, $89,300, is second only to Los Angeles. The designated tracts are a different picture, with a median poverty rate of 26.1%. The county is 52.5% non-Hispanic white and 31.2% Hispanic.
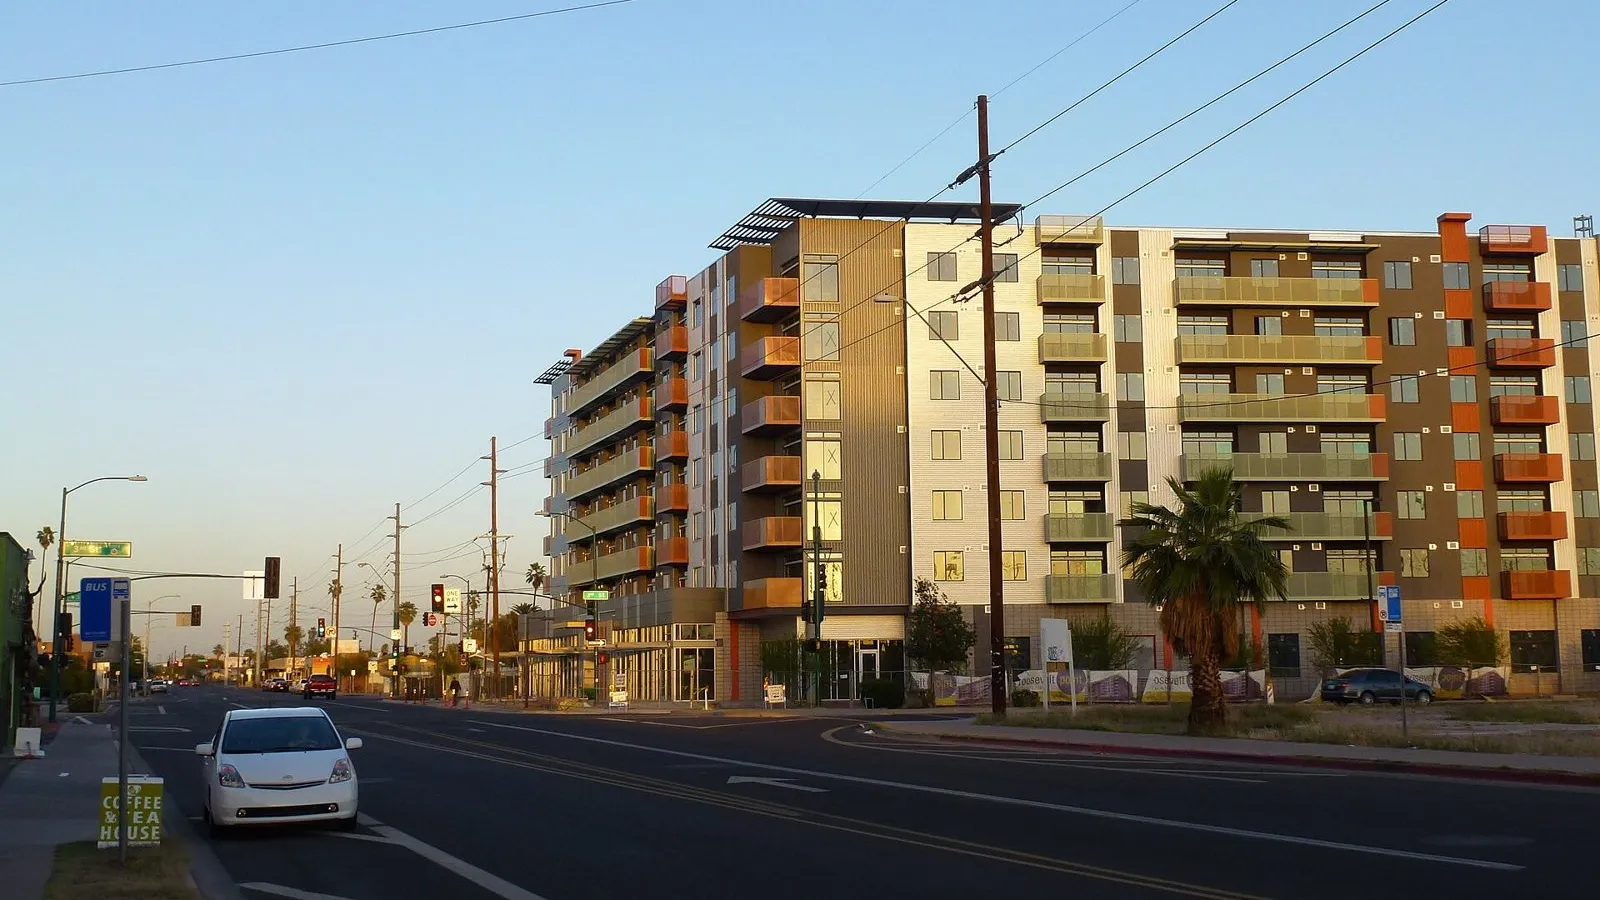
The region’s economy is being remade by chipmaking. In March 2025, Taiwan Semiconductor Manufacturing Co. said it would expand its planned U.S. investment to $165 billion, adding $100 billion to the $65 billion already going into its Phoenix fabs. Downtown is changing too. Arizona State University’s Downtown Phoenix campus, at 411 North Central Avenue, falls in designated tract 1131, which was also a 2018 zone. The county had 85 zones on the first map.
7. Bronx County, New York: 57 tracts
The Bronx is the poorest county on this list. Its median household income is $48,676, and its poverty rate is 27.8%, more than double the national rate. Three of every four Bronx census tracts were eligible, 270 of 361. Bronx County has 57 zones, and in those tracts the median poverty rate is 35.7%, the highest in the top ten.
The biggest clusters are in the South and West Bronx. Mott Haven–Port Morris, Concourse and University Heights–Fordham have 5 each. Longwood, Crotona Park East, Highbridge and University Heights–Morris Heights have 4 each, and Hunts Point has 3. The Highbridge–Concourse community district has 9, the most of any district in the borough. The Bronx is 55.1% Hispanic and 28.7% Black, and about a third of its 1.4 million residents were born abroad.
Transit may be the borough’s biggest change. The MTA’s Penn Station Access project will add four new Metro-North stations in the East Bronx: Hunts Point, Parkchester–Van Nest, Morris Park and Co-op City. The MTA says the project will cut some trips between the Bronx and Manhattan by up to 50 minutes and is expected to be finished in 2030. Bisnow noted that parts of the East Bronx near the new stations are on the 2027 map.
The borough had 75 zones under the first map.
8 (tie). Harris County, Texas: 51 tracts
Harris County is the opposite of Hidalgo, the county it ties with. It has 500 eligible tracts, more than any county on this list except Los Angeles. But only 51 were designated, 10.2%, the lowest share in the top ten. Harris holds a fifth of the eligible tracts in Texas and received 8.4% of the state’s designations. It had 105 zones under the 2018 map.
Houston has 43 of Harris County’s zones, unincorporated areas have 5 and Channelview has 3. Two are rural. Within Houston, the zones cluster north and east of downtown. The Near Northside and Trinity/Houston Gardens have 5 each. The Greater Fifth Ward and the Astrodome area have 4 each, and East Houston has 3. Countywide, Harris’s 4.8 million residents are 44.0% Hispanic and 18.6% Black, and median household income is $74,983. In the designated tracts, the median poverty rate is 29.3%.
The county’s economy turns on the Houston Ship Channel. Port Houston reported record container volume in 2025: 4,303,345 units, up 4%, along with 54.5 million short tons of cargo. In the Fifth Ward, the old DeLuxe Theater on Lyons Avenue sits in designated tract 2113.01.
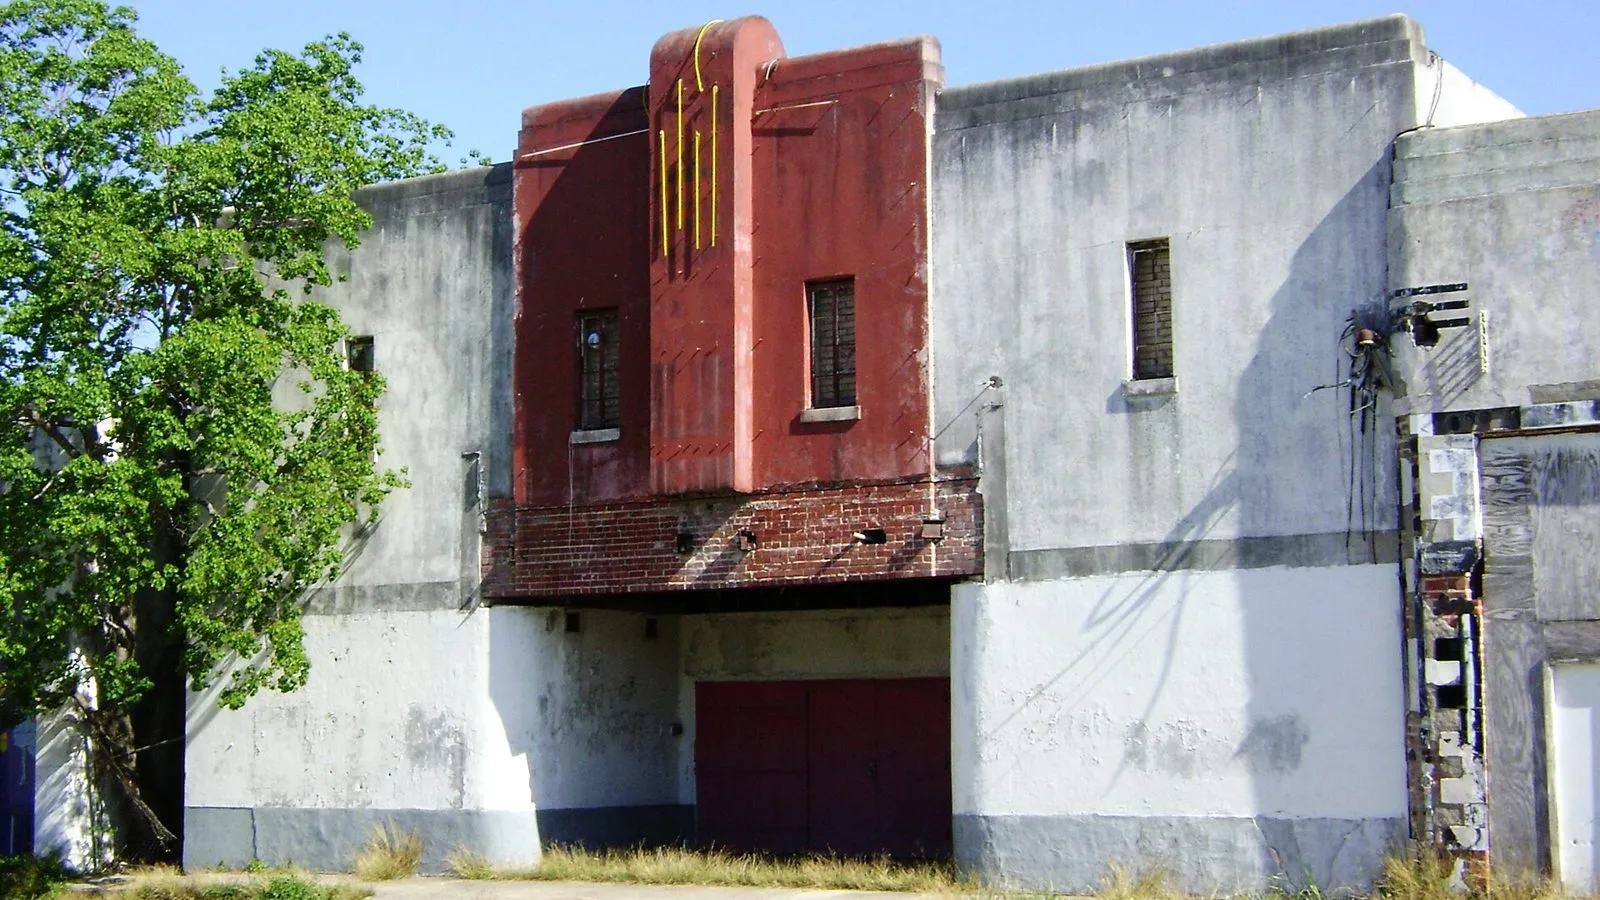
8 (tie). Hidalgo County, Texas: 51 tracts
Hidalgo County is the surprise of the top ten. It has 892,000 residents and only 212 census tracts, a fraction of the big urban counties around it on this list. But 133 of those tracts were eligible, and Texas designated 51 of them, 38.3%. That is the highest rate in the top ten and well above the 25% that each state could designate overall. Hidalgo holds 5.5% of Texas’s eligible tracts and got 8.4% of its zones.
This is the heart of the Rio Grande Valley, on the Mexican border. The county is 91.9% Hispanic, and its median age, 30.5, is the youngest on this list. Median household income is $54,338, and the poverty rate is 26.7%. Pharr and Edinburg have 12 zones each, unincorporated areas have 12, Weslaco has 7 and McAllen has 4. Two are rural.
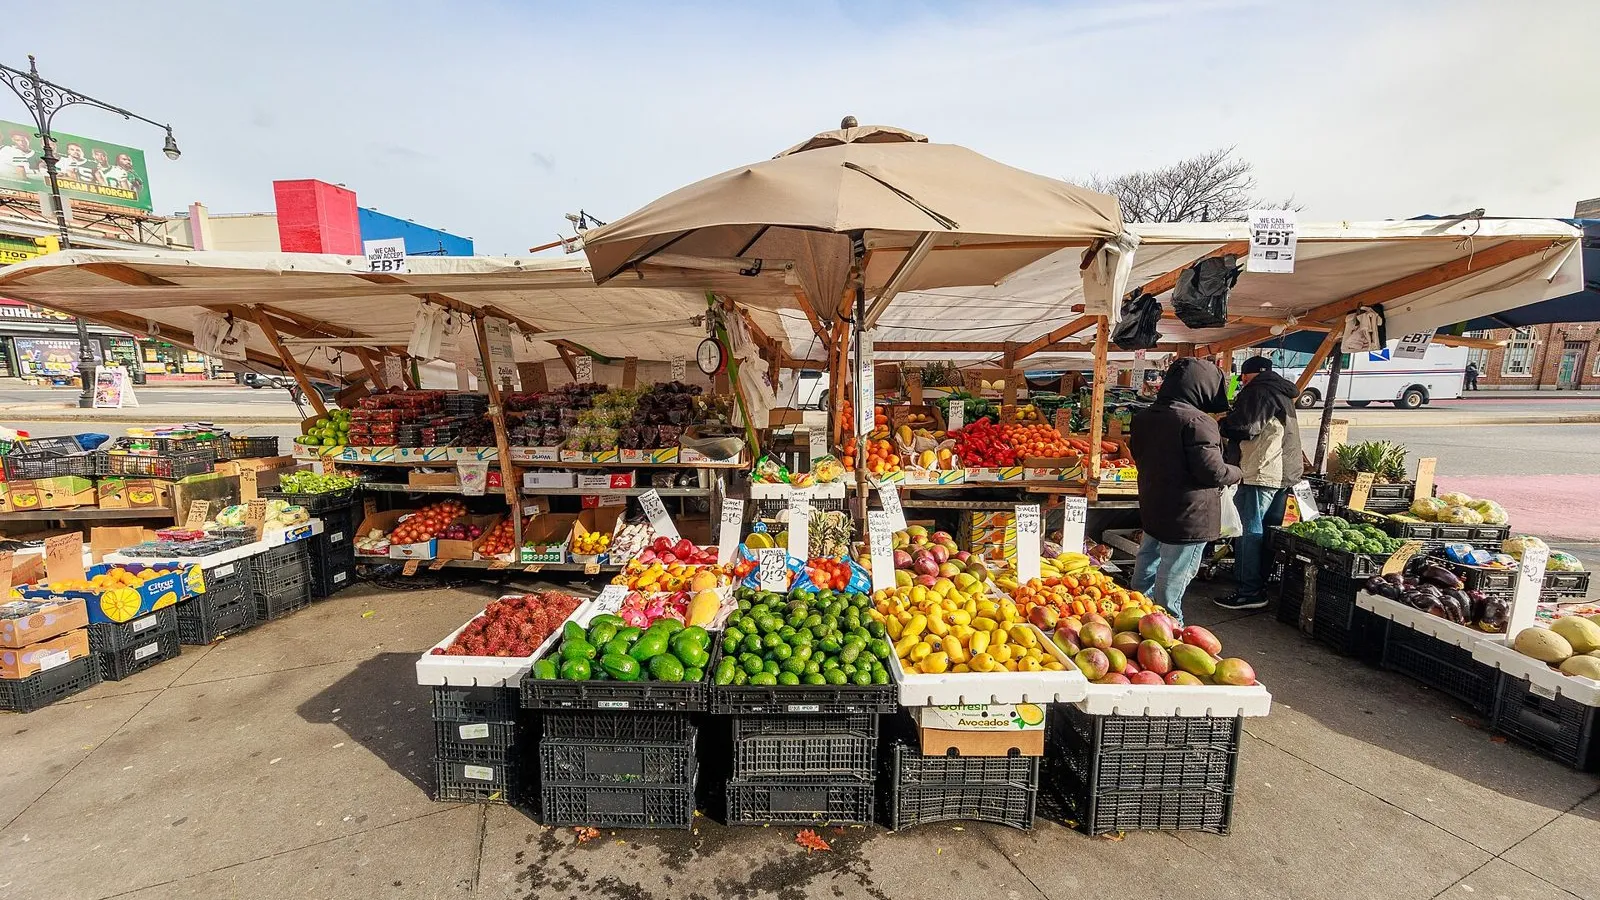
Trade runs through Pharr. The Pharr International Bridge is the top produce crossing in the United States, and about 70% of the avocados entering the country cross there, bridge director Luis Bazán told KRGV. “Produce trucks alone you’re accounting for about 110 thousand shipments or truckloads per year,” he said. The bridge’s address falls in designated tract 213.09.
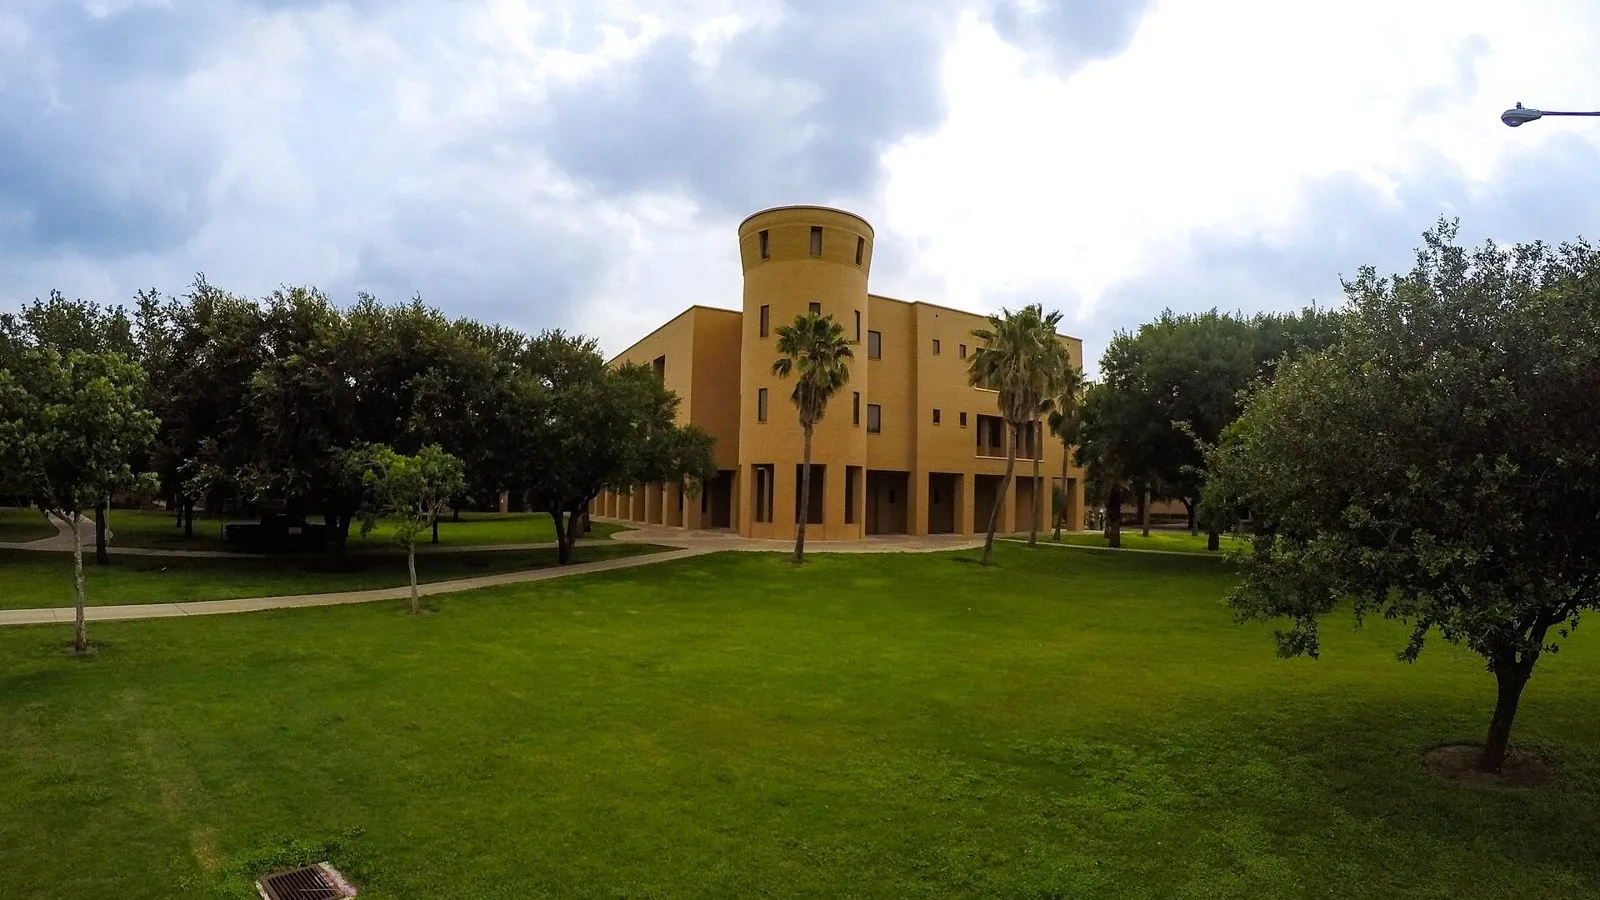
In Edinburg, the University of Texas Rio Grande Valley enrolled a record 36,466 students in fall 2026, its seventh straight first-day record. Its Edinburg campus is in designated tract 240.01. “Setting an enrollment record once is significant. Doing it seven years in a row tells you something much bigger,” said university president Guy Bailey. Under the 2018 map, Hidalgo had 23 zones.
8 (tie). Miami-Dade County, Florida: 51 tracts
Miami-Dade has the largest share of immigrants of any county on this list: 54.5% of its 2.7 million residents were born outside the United States. It is 69.3% Hispanic, and its median age, 40.7, is the oldest in the top ten. Median household income is $71,753. Miami-Dade holds 18.1% of Florida’s eligible tracts and received 14.9% of the state’s 342 designations. In the designated tracts, the median poverty rate is 27.1%.
The city of Miami has 24 of the county’s 51 zones. Unincorporated areas have 4, and Gladeview and Miami Beach have 3 each, among 17 cities and communities. Within Miami, the designated tracts include parts of Little Haiti, Little River, Liberty City, Overtown and Allapattah, the Civic Center health district, East Little Havana and the West Grove. The Little Haiti Cultural Complex is in a designated tract.
Some of the biggest public investment is in housing. In February 2026, the county broke ground on Liberty Square Phase V, with 408 units, and Liberty Square for the Elderly, with 132, at 1441 NW 62nd Street in Liberty City. Both are part of the county’s rebuilding of Liberty Square, a historic public housing community. The site is in designated tract 15.01, which was also a 2018 zone. Jackson Memorial Hospital, in the Civic Center district, is in a designated tract too.
The county’s economy leans on the water. PortMiami set a record of 8,564,225 cruise passengers in fiscal 2025 and handled more than a million container units for the 11th year in a row. Miami-Dade had 67 zones in 2018.

What the top ten have in common
Size explains most of this list. Federal law caps each state’s zones at 25% of its eligible tracts, IRS Notice 2026-67 notes. All seven states in the top ten designated close to that limit. Big counties with many poor tracts start with the most chances; our guide to the 25% state cap explains how that math works.
State choices explain the rest. Every state in the top ten gave its largest county a smaller share of its zones than that county’s share of eligible tracts, sending the difference to other regions. The gap was widest in Illinois, where Cook had half the eligible tracts and got 35% of the zones, and in Texas, where Harris had a fifth of the eligible tracts and got 8.4%. Texas went the other way in the Rio Grande Valley, designating Hidalgo tracts at well above the statewide rate.
The map also changed more than many people expected. FBT Gibbons counted 2,393 of the 8,764 tracts from 2018 that kept the same tract number in 2027, about 36% of the new list. The ten counties here had 1,047 zones on the 2018 map and have 746 on the new one.
What happens next
The 2027 zones take effect on January 1, 2027. The 2018 zones remain in effect through December 31, 2028, under the schedule Texas describes. Anyone can check whether an address is inside a new zone with the designation checker, browse the full OZ 2.0 final list or explore the map. For more on how the list was built, see our reports on Treasury’s final list, the 2,594 rural zones and Cook County’s 84 tracts.
This article is for general information. It is not tax, legal or investment advice.
FAQ
Which county has the most Opportunity Zones in 2027?
Los Angeles County, California, has 201 designated tracts on Treasury’s final list. That is more than any other county and more than the whole total of 46 of the 56 states and territories on the list.
Which counties are in the top ten?
Los Angeles (201), Cook, Illinois (84), Kings (Brooklyn), New York (67), Wayne, Michigan (65), Dallas, Texas (60), Maricopa, Arizona (59), Bronx, New York (57), and a three-way tie at 51 among Harris and Hidalgo counties in Texas and Miami-Dade, Florida.
Why do these counties have so many zones?
Mostly because they are large and have many low-income tracts. Each state could designate up to 25% of its eligible tracts, and every state here used close to its limit. State choices also mattered: Illinois, Michigan, New York and Texas gave their largest urban counties a smaller share than their share of eligible tracts, while Texas designated Hidalgo County tracts at a high rate.
Can 2027 tract counts be compared with the 2018 map?
Only roughly. The 2018 list used 2010 census tracts, and the 2027 list uses 2020 tracts, which were redrawn.
When do the new zones take effect?
January 1, 2027. They run for ten years, through December 31, 2036, under IRS Notice 2026-67.
- home.treasury.gov (1), as of November 20, 2026
- cdfifund.gov (1), as of November 20, 2026
- home.treasury.gov (2), as of November 20, 2026
- cdfifund.gov (2), as of November 20, 2026
- irs.gov, as of November 20, 2026
- www2.census.gov, as of November 20, 2026
- jdsupra.com, as of November 20, 2026
- business.ca.gov, as of November 20, 2026
- portoflosangeles.org, as of November 20, 2026
- af.mil, as of November 20, 2026
- bisnow.com (1), as of November 20, 2026
- gov-pritzker-newsroom.prezly.com, as of November 20, 2026
- iqmp.org, as of November 20, 2026
- obama.org, as of November 20, 2026
- bisnow.com (2), as of November 20, 2026
- esd.ny.gov, as of November 20, 2026
- edc.nyc, as of November 20, 2026
- ksmcpa.com, as of November 20, 2026
- michiganbusiness.org, as of November 20, 2026
- michigancentral.com, as of November 20, 2026
- detroitmi.gov, as of November 20, 2026
- dallascityhall.com, as of November 20, 2026
- bisnow.com (3), as of November 20, 2026
- gov.texas.gov, as of November 20, 2026
- dallasconventioncenter.com, as of November 20, 2026
- azcommerce.com, as of November 20, 2026
- pr.tsmc.com, as of November 20, 2026
- mta.info, as of November 20, 2026
- porthouston.com, as of November 20, 2026
- krgv.com, as of November 20, 2026
- utrgv.edu, as of November 20, 2026
- miamidade.gov (1), as of November 20, 2026
- miamidade.gov (2), as of November 20, 2026
Original reporting by the Opportunity Zone Invest Editorial Team for Opportunity Zone Invest, an independent OZ 2.0 research site. Facts are drawn from the primary sources cited above per our editorial standards. Nothing here is tax, legal, or investment advice. Found an error? See our corrections policy or write to Opportunity Zone Invest.
OZ tools: Opportunity Zone calculator · OZ 2.0 designation checker · 180-day rule calculator · Form 8997 instructions · Form 8996 instructions · all tools
Get OZ 2.0 updates
OZ 2.0 news, guidance, and key deadlines. Unsubscribe anytime.